Kaien Island Model
As a part of a project for Mavi Innovations Inc., Ocean Ecology developed an ocean circulation model for a region around Kaien Island. ROMS (Regional Ocean Modeling System) was chosen to carry out the ocean current studies. ROMS is a three-dimensional, free-surface, terrain-following numerical model that solves the Reynolds-averaged Navier-Stokes equations (equations used to describe Newton’s Second Law of Motion in incompressible fluids) using the hydrostatic and Boussinesq assumptions. ROMS uses an orthogonal curvilinear coordinate system.
Ocean Ecology selected ROMS to carry out current modeling in the waters around Kaien Island for several reasons:
- ROMS has been used successfully in small-scale applications (many ocean models are designed to function at much larger scales than the region around Kaien Island).
- ROMS has a highly flexible, modular design which allows it to be readily modified for use in a number of applications. Furthermore, additional modules (such as sediment transport, biology, or waves) can be added to the application design as required.
- ROMS is used widely throughout the world, and is well supported by the scientific community. The most active modeling groups using ROMS are Rutgers University, UCLA, Oregon State University, Scripps, University of Colorado, and IRD (Institut de Recherche pour le Developpement). ROMS is also in use by DFO (modeling the Strait of Georgia) and UBC Fisheries Center (in combination with Ecopath/Ecosim).
- ROMS has an active support group at Rutgers University, with new code enhancements being regularly added to the model. This ensures that the model’s function is well vetted, and that new model users have a good support network.
Oceanographic data coverage is relatively poor for Northern B.C. As a result, modeling for this region needs to take place in two steps: (1) an initial model is created using sparse, and often global, data sets; (2) data is collected locally and assimilated into the model to improve the model’s accuracy.
Atmospheric data for the model is being drawn from the NCEP North American Regional Reanalysis (NARR) data set. This is the most precise data set for regions in North America. It has a 32 km horizontal resolution and a 45 layer vertical resolution.
Climatology data comes from the Polar Science Center Hydrographic Climatology. This data set provides temperature and salinity data at a 1 degree resolution down to a depth of 5500 m. It has been created by combining the NODC’s 1998 world climatology (WOA), the EWG Arctic Ocean Atlas (AOA), and select Canadian data provided by the Bedford Institute of Oceanography (BIO) in order to improve coverage in northern regions.
Tidal data for the model comes from Oregon State University’s TOPEX/Poseidon Global Inverse Solution (Model_tpxo7.2). This is a global model of ocean tides, which best-fits, in a least-squares sense, the Laplace Tidal Equations and along track averaged data from TOPEX/Poseidon and Jason (on TOPEX/POSEIDON tracks since 2002) obtained with OTIS. Model_tpxo7.2 was chosen due to the sparsity of current data in the Prince Rupert area. Although there is tide station data from Port Edward, Wainwright Basin, Morse Basin, and Seal Cove, there is only one current station for the entire harbour area, and that is at Casey Point on the east side of Digby Island (see map below). Model_tpxo7.2 is based on satellite observations of SSH (sea surface height), and provides better coverage in the area around the east side of Kaien Island.

The Kaien Island model is approximately 12.2 km in the N-S dimension and 6.9 km in the E-W dimension.

From the model, we observe that on the flood cycle, water flows into Morse Basin through both Butze Rapids in the north and Zanardi Rapids in the south. Maximum current flows occur in the narrow channels associated with each rapid, whereas current flow is much reduced in the Morse Basin region. Complicated coastline topography creates significant eddy features in Wainwright Basin, and the confluence of currents in Morse Basin also generates large eddy features. On the ebb cycle, water exits from Morse Basin through both Butze Rapids and Zanardi Rapids. Maximum current flow in Butze Rapids occurs on the outgoing ebb tide. Maximum current flow in Zanardi Rapids occurs on the incoming flood tide. The spring tide run of the model agrees well with the one maximum current velocity value shown on the Prince Rupert Harbour chart that is within the model domain. Seal Cove has a current arrow showing a value of 1.5 knots. The model computes a value of 0.83 m/s or 1.61 knots for the same location.


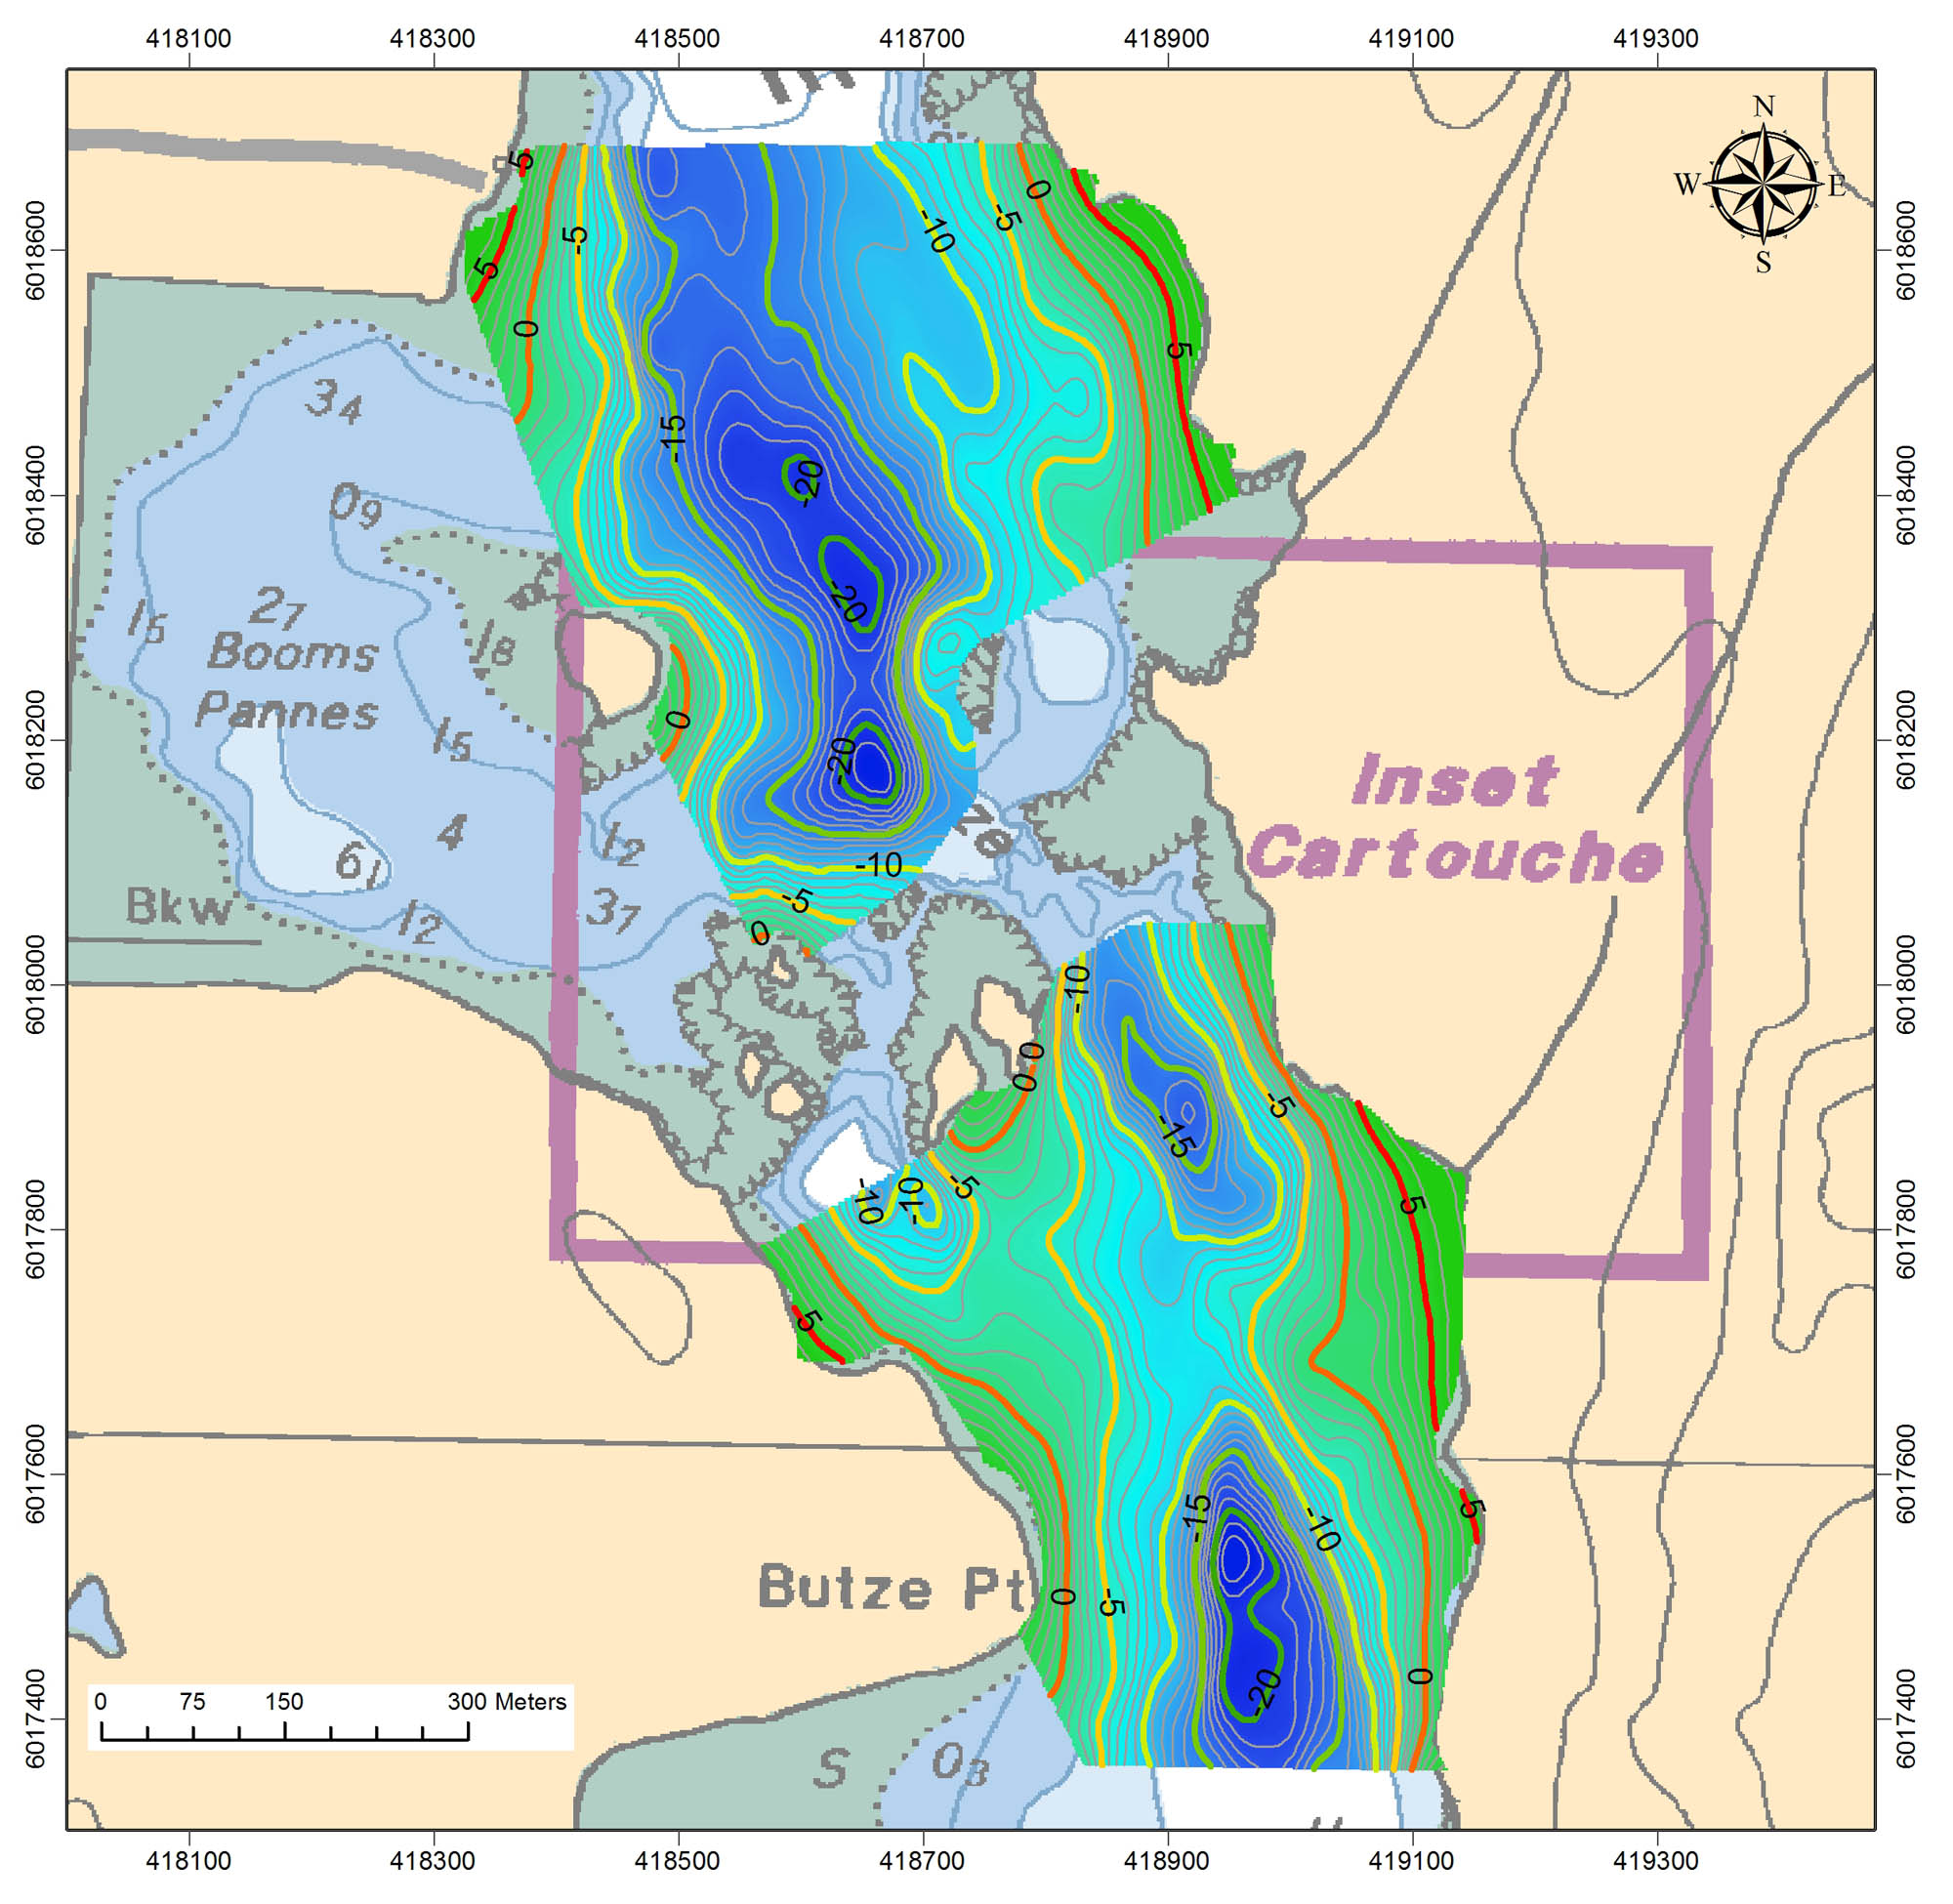
To ground-truth the model, and further refine it, bathymetry and current data was collected in the region around Butze Rapids. The seafloor depth was accurately mapped on the north and south side of the rapids. This work was required to ensure that that the bathymetry used for tidal modeling was correct. The data was collected using a transducer mounted in a towfish (mapping sounder) that was towed at 2 m depth. The survey resolution was a 25 m grid.
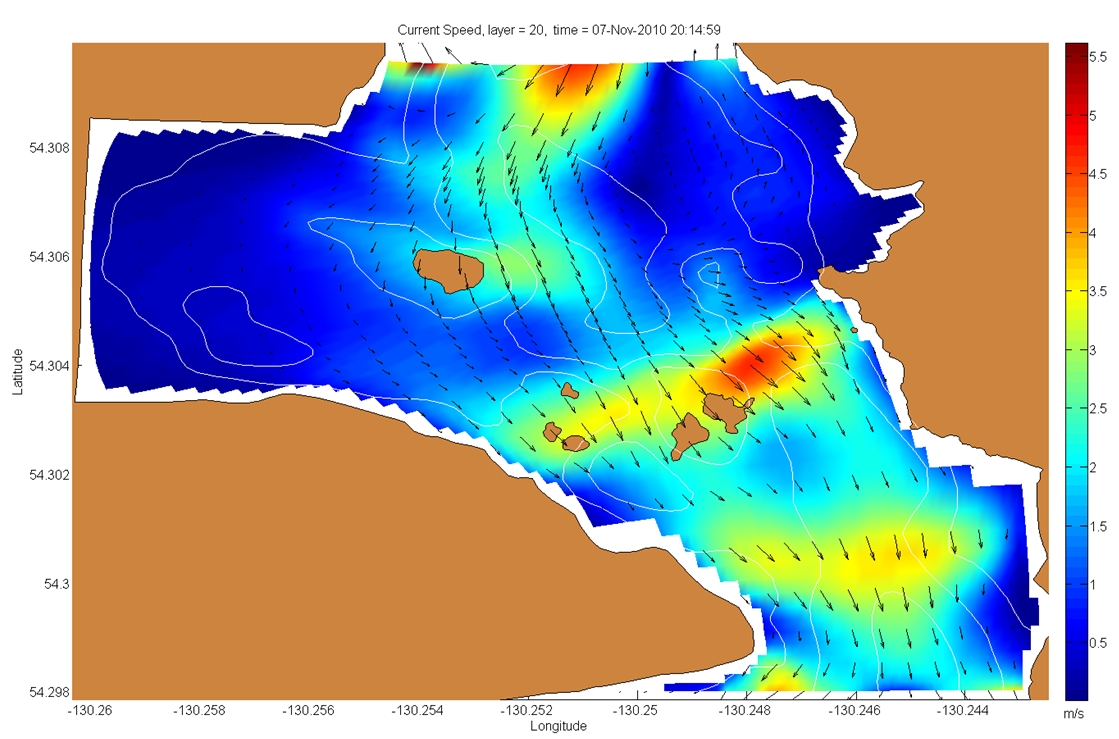
In the fall of 2010, Ocean Ecology performed a current survey for Butze Rapids in order to acquire field data for validation and refinement of the ROMS model. The current studies at Butze Rapids were performed using a 0.4 MHz Nortek Aquadopp Acoustic Doppler Current Profiler (ADCP) as described in the methodology here.Using the Oregon State University’s tidal inversion software, OTISoo (a modeling tool that uses 4-D variational assimilation to assimilate Sea Surface Height [SSH] and velocity observations into a solution of the barotropic, shallow-water equations for a specified domain), the new current data was “assimilated” with the existing TPXO7.2 model to create a more detailed tidal model for the Butze Rapids area.
The ROMS model was then run again using the more detailed bathymetric and tidal data. The image below is an example of the results that were generated. The current patterns are much more detailed, showing both areas of high current velocity as well as eddies.